Welcome back to our series on report writing. Today, we are going to talk about using pre-filled charts and tables to expedite your report writing. If you are new to the series on Tips for Faster Report Writing, check out our first post on setting up a report template and work your way through the series.
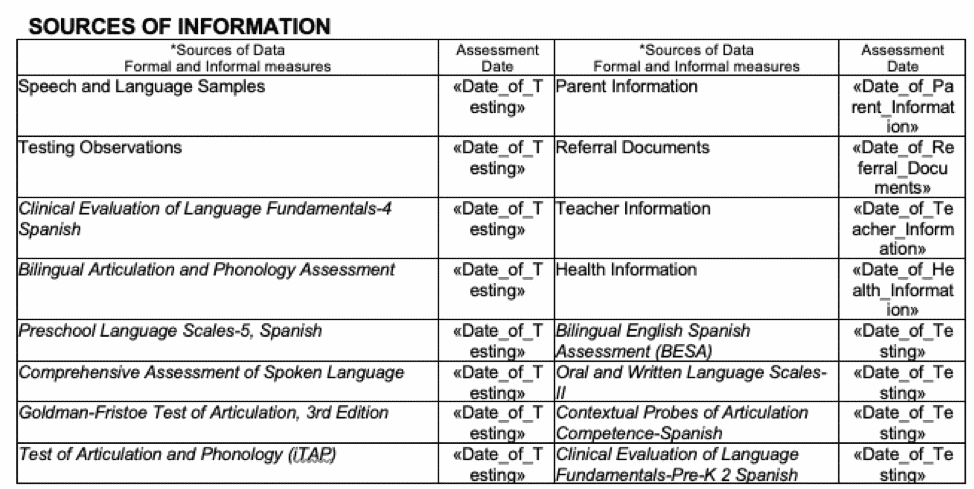
I include a lot of tables in my reports. Some of them are filled with merge codes. Some of them are pre-filled. Below is an example of a table that is filled with merge codes. We need to include all of our sources of information with dates. A lot of that information comes from the documents that are included in the referral folder. Others come from the testing sessions. Using this table, I include the tests that I use most frequently and merge the testing date into the date boxes. Then, I delete the tests I do not use. I always find that it is faster to delete than it is to create something or to go find it somewhere else and copy it in.

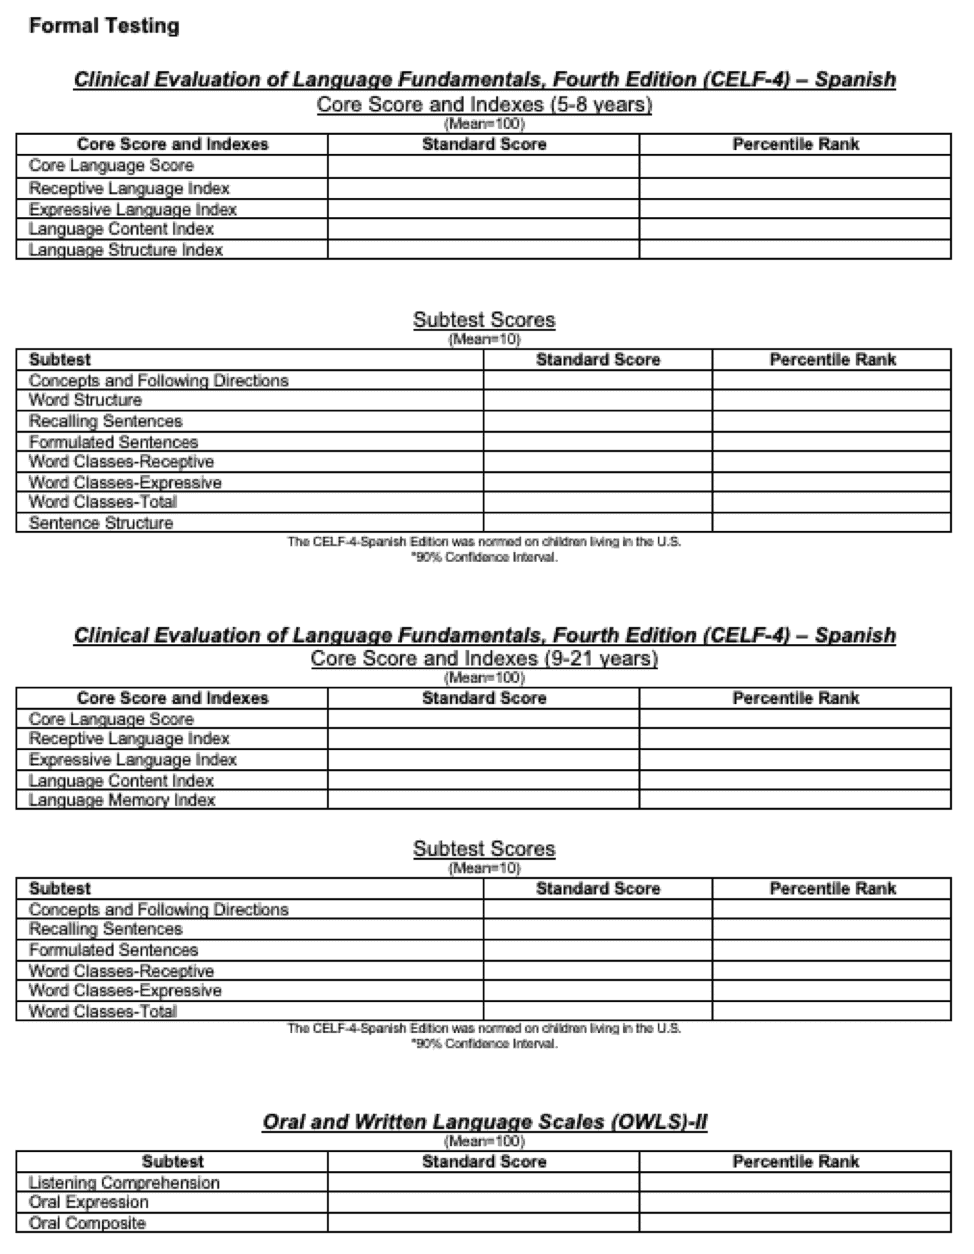
Set up tables for each of the tests use you. Then, you only need to fill in the numbers. Here’s an example from my template.

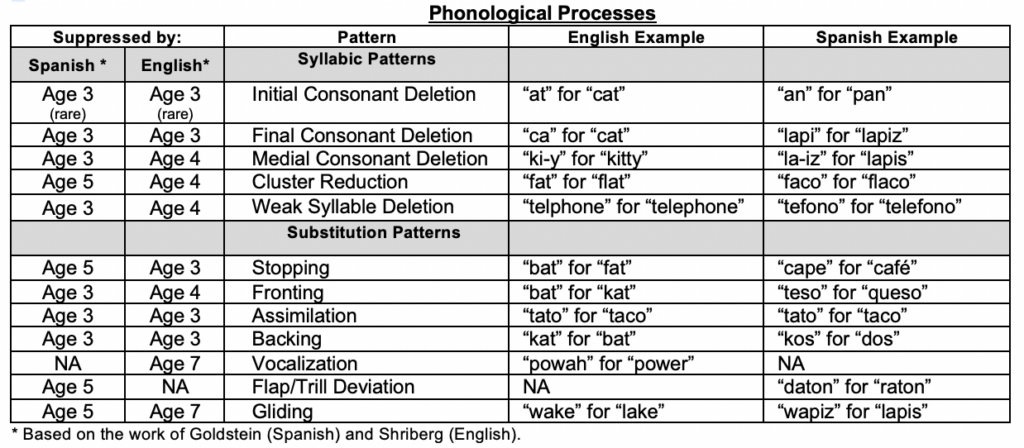
And here is one of my favorites. With this chart of phonological processes, I provide examples that STAY IN MY CHART. Earlier in my career, I felt the need to put examples specific to the child in my chart. Then, I realized that the purpose of my chart is to help the reader understand the types of errors being made. I can still include a speech sample for the child so his or her specific examples are known, but I don’t need to change up my chart. Instead, I just delete the lines that are not appropriate for the student I am writing about. Also, I include developmental information for both Spanish and English in the table so I don’t have to look it up over and over.

You can download a version of this chart .
If you want to include test descriptions in your report, check out the awesome resource at Home Speech Home.
Next up: Pre-Written Paragraphs


Question 1.If we use these charts, do we have to give credit to the source?
Question 2. For the phonological processes chart, do you always include those examples for each process or do you include the processes produced by the student?
Hi Jessica,
Great questions.
Answer 1: Within the charts, there are sources for the norms. I would keep those in there. Beyond that, no need to cite.
Answer 2: I do always keep the examples in the chart. If the child only speaks one language, I delete the columns that address the other language. I then include examples of the child’s actual utterances in a speech sample at the bottom of my articulation/phonology section.
I really liked the Home Sweet Home resource but it has not been updated for more current editions of many of the tests. Do you know if there is an updated template as many of the new versions do not fit the old templates?
Hi Karen,
You are right that it has not been updated recently. We’ve done some updates piecemeal as we’ve needed them but I hesitate to share their document with our updates. I’ll reach out to them to discuss. Thanks! Ellen
Hi Ellen,
Thank you for making a download available of the “Phonological Processes: Norms” chart. I noticed that the download version does not match the chart shown on this page; on the download version, there is a row under syllable patterns that includes GLIDING/ “bwack”for black. You also have “LIQUID SIMPLIFICATION/ “wake” for lake under Substitution Patterns. Wouldn’t Gliding and Liquid Simplification be the same pattern, and wouldn’t it be considered a substitution pattern?
I am the bilingual evaluator on our school district’s preschool eval team. I have been an SLP Impact member since I began this position and I use your resources all the time! Thank you for the work you do.