 Welcome back to our series on report writing. Today, we are going to talk about how to organize your assessment results. If you are just jumping in, check out our first Evaluation Report Writing Tip post on setting up a report template and work your way through the series.
Organizing all of the data we collect during the assessment process is a challenge for many of us. We have information about receptive language skills, expressive language skills, pragmatic language skills, language content, language form, speech, strengths, and weaknesses. For our bilingual students we have data in each language for all of those areas. Organizing your assessment results into a coherent report can feel overwhelming. Here’s the way I go about it.

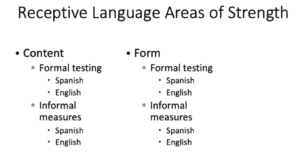
Use Receptive and Expressive Language as your overarching categories for organizing your assessment results. Within each of those sections create a section for strengths and weaknesses. Within your strengths and weaknesses address content, form, and use. Within each of those sections include information from both your formal measures and your informal measures. And for those of you working with bilingual children, address what they are able to do in each of their languages within the previous sections.
I’ve seen reports with separate write-ups for English and Spanish. Then I have to go in and decipher whether the student has a skill in one or the other language. It really doesn’t matter if they do something in English or in Spanish or in Vietnamese. What we want to know is whether they have the skill at all. So, writing about the languages separately can make it difficult for the receiving SLP to know what to work on.
Here is an outline for organizing your assessment results for Receptive Language Strengths. I then do the same for Receptive Language Weaknesses, Expressive Language Strengths, and Expressive Language Weaknesses.

You can download sample text excerpts here. Another great resource for report writing is this blog post by the Dabbling Speechie.
Next up: Using Pre-Filled Tables and Charts


