As one of the authors of the Bilingual Articulation and Phonology Assessment app, I get to field questions from all of the great  SLPs who use this amazing tool. One of the questions I get a lot is about the standard scores and percentiles. They don’t look like they do for most language tests, and there is a good reason for that.
Sometimes, I get nice notes that say, “I noticed that there might be a typo in the percentiles because they don’t seem to line up correctly with the standard scores.”
Other times I get not-so-nice notes that have subject headings like this one:
Subject: PSYCHOMETRIC CONVERSION IS WRONG
I have noticed with your app that your standard scores and percentiles DO NOT follow the psychometric conversion. Please make this adjustment ASAP.
If the standard score in Spanish is Less than English HOW COME the percentile is higher?
Here is how I responded to that one:
Dear SLP-who-is-paying-attention,
Thank you so much for your feedback on the BAPA. This is a question we get a lot.
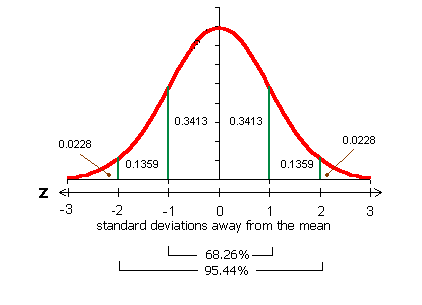
When we norm a test, we base it on the data from the normative sample. For most language tests, the data fall in the form of the bell curve, or the normal curve, that looks like this:
When we are dealing with a normal curve, the percentiles and standard scores are always consistent. A standard score of 100 yields a percentile of 50, while a standard score of 85 yields a percentile ranking of 16. In other words, 50% of the people scored below a standard score of 100 and 50% scored above it.
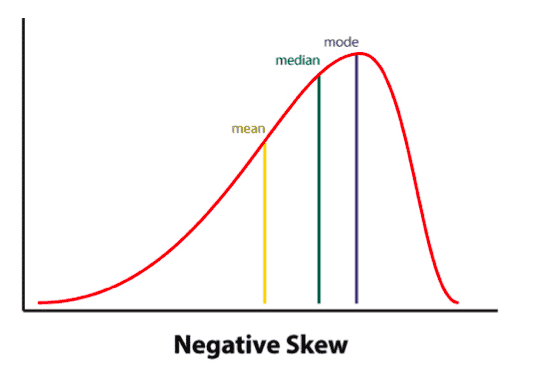
For most articulation tests, regardless of language, the data do not fall into a normal curve because children make a lot of errors early on and usually achieve mastery of speech sounds by age 8. This developmental pattern results in a negatively skewed distribution that looks like this:
You can see here that at the mean (standard score of 100), the percentile will be lower than it is for the normal curve because there are fewer people who score below that point. You can see this same type of scoring on The Goldman Fristoe Test of Articulation. For example, on the GFTA 2, for females who are 7;3-7;5, the standard score of 100 is associated with a percentile ranking of 29 but for a female who is 11-0-11;1 a standard score of 100 corresponds to a percentile ranking of 22.
For the BAPA, we used three different groups of children to norm the test. We have one normative group for the monolingual English speakers. We also have a normative group for bilinguals in English. Finally, we have a Spanish normative group that is comprised of both monolingual and bilingual speakers of Spanish. We were able to combine those two groups because they looked almost identical. This was not surprising to us since the vast majority of these students were children who were from Spanish-speaking homes who were learning English as their second language. So for both the monolingual Spanish speakers and the bilinguals speaking Spanish, their native language was Spanish.
So to address your specific question of why a standard score in one language corresponds to a different percentile in another language, it is because our norms are based on three different negatively skewed curves, all of which looked a bit different from each other.
Thanks for paying attention!
Here’s a great write-up about this same issue with the GFTA.
Also check out:
Phonological Processes in Spanish-English Bilingual Children


 SLPs who use this amazing tool. One of the questions I get a lot is about the standard scores and percentiles. They don’t look like they do for most language tests, and there is a good reason for that.


