If a child is having difficulty producing a sound, is it a true error or is it due to influence from his first language?
Let’s begin with a quick look at the following Venn Diagram and then take a stroll through the research.
Positive Transfer
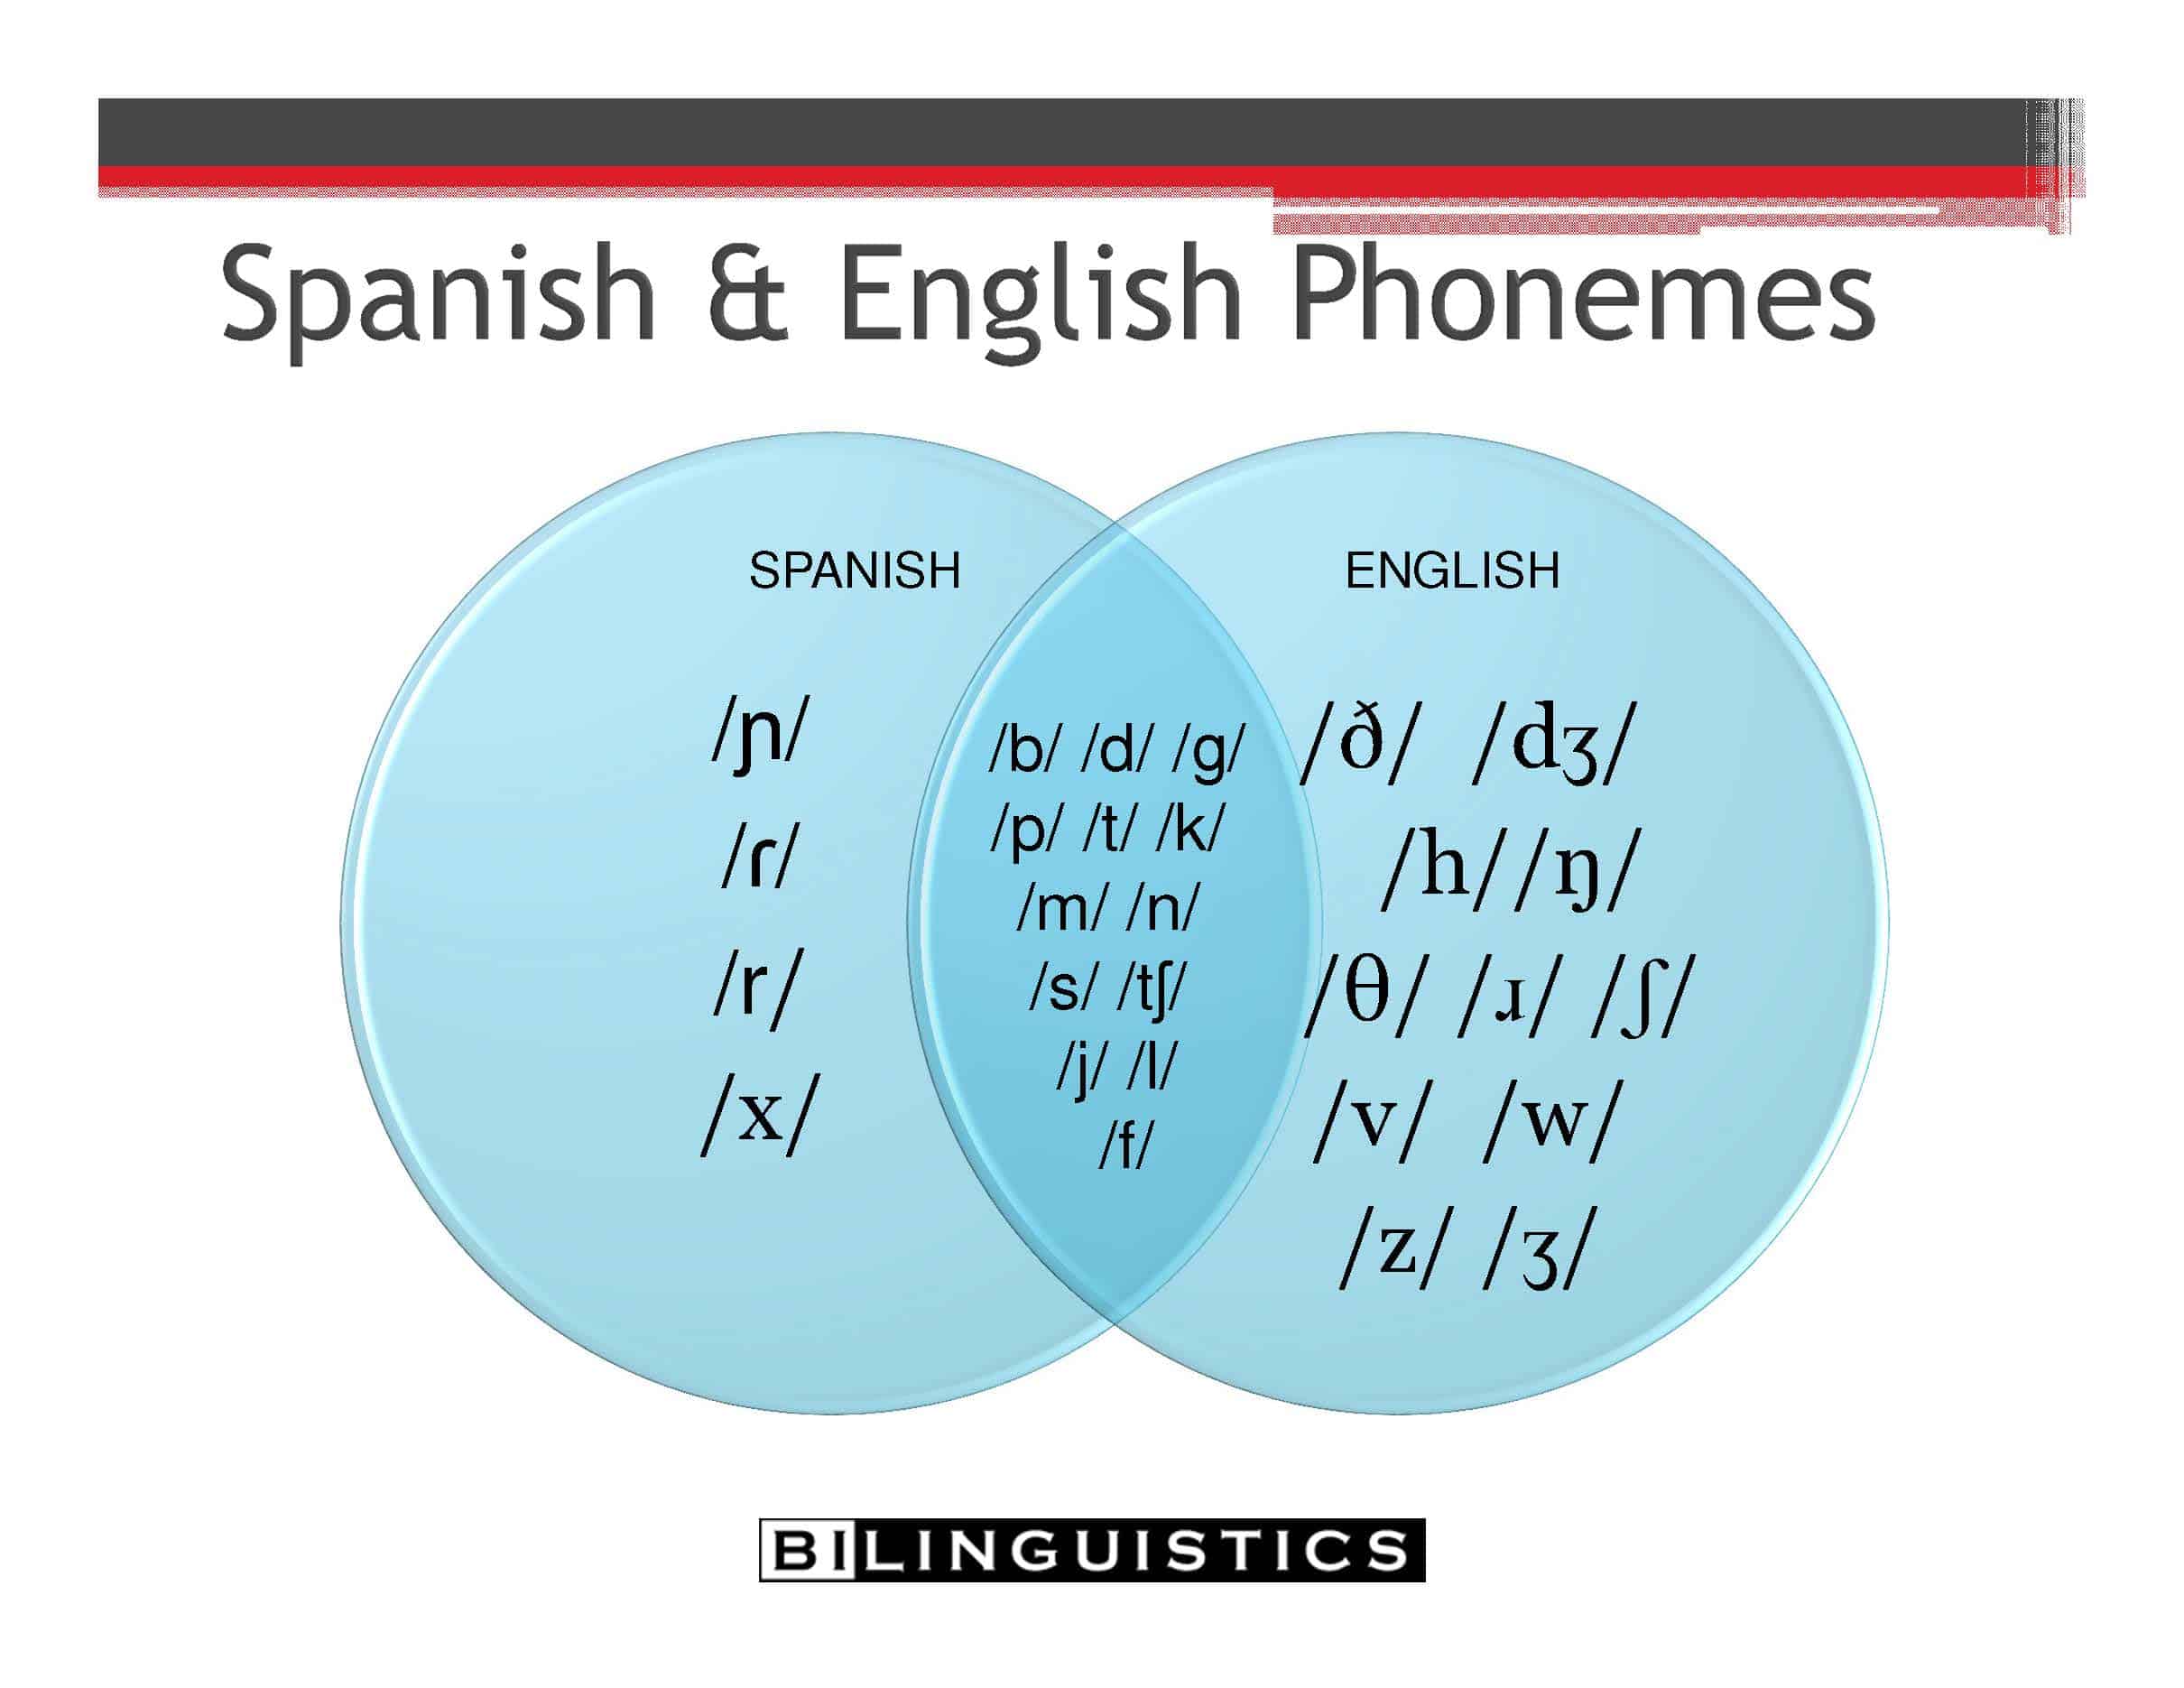 If two languages share a sound, you would expect that the shared sounds would not be difficult for a second-language learner to produce in their second language. For example, English and Spanish both have /b/ so the word “baby (bebe)” should not be a problem.
Negative Transfer
If a sound is not shared by two languages, you would expect the second-language speaker to 1) delete 2) distort or 3) replace the sound. This is in fact the case. Let’s use Spanish and take a look at a few examples:
- Deletion: Don’t becomes Don REASON: No final /t/ and no final clusters in Spanish
- Distortion: Spaghetti becomes Espaghetti REASON: No initial /s/ cluster in Spanish
- Replacement: This becomes Dis REASON: No /th/ so the brain chooses the most similar sound from the first language.
A Venn Diagram lays this out nicely. Sounds that both languages share fall in the center and sounds that are specific to each language are on the sides. So who would have an easier time learning the sounds of the second language? That’s right, the English speaker has a lot less to learn in order to produce all of the sounds of Spanish.
Articulation errors & second-language learners: The research
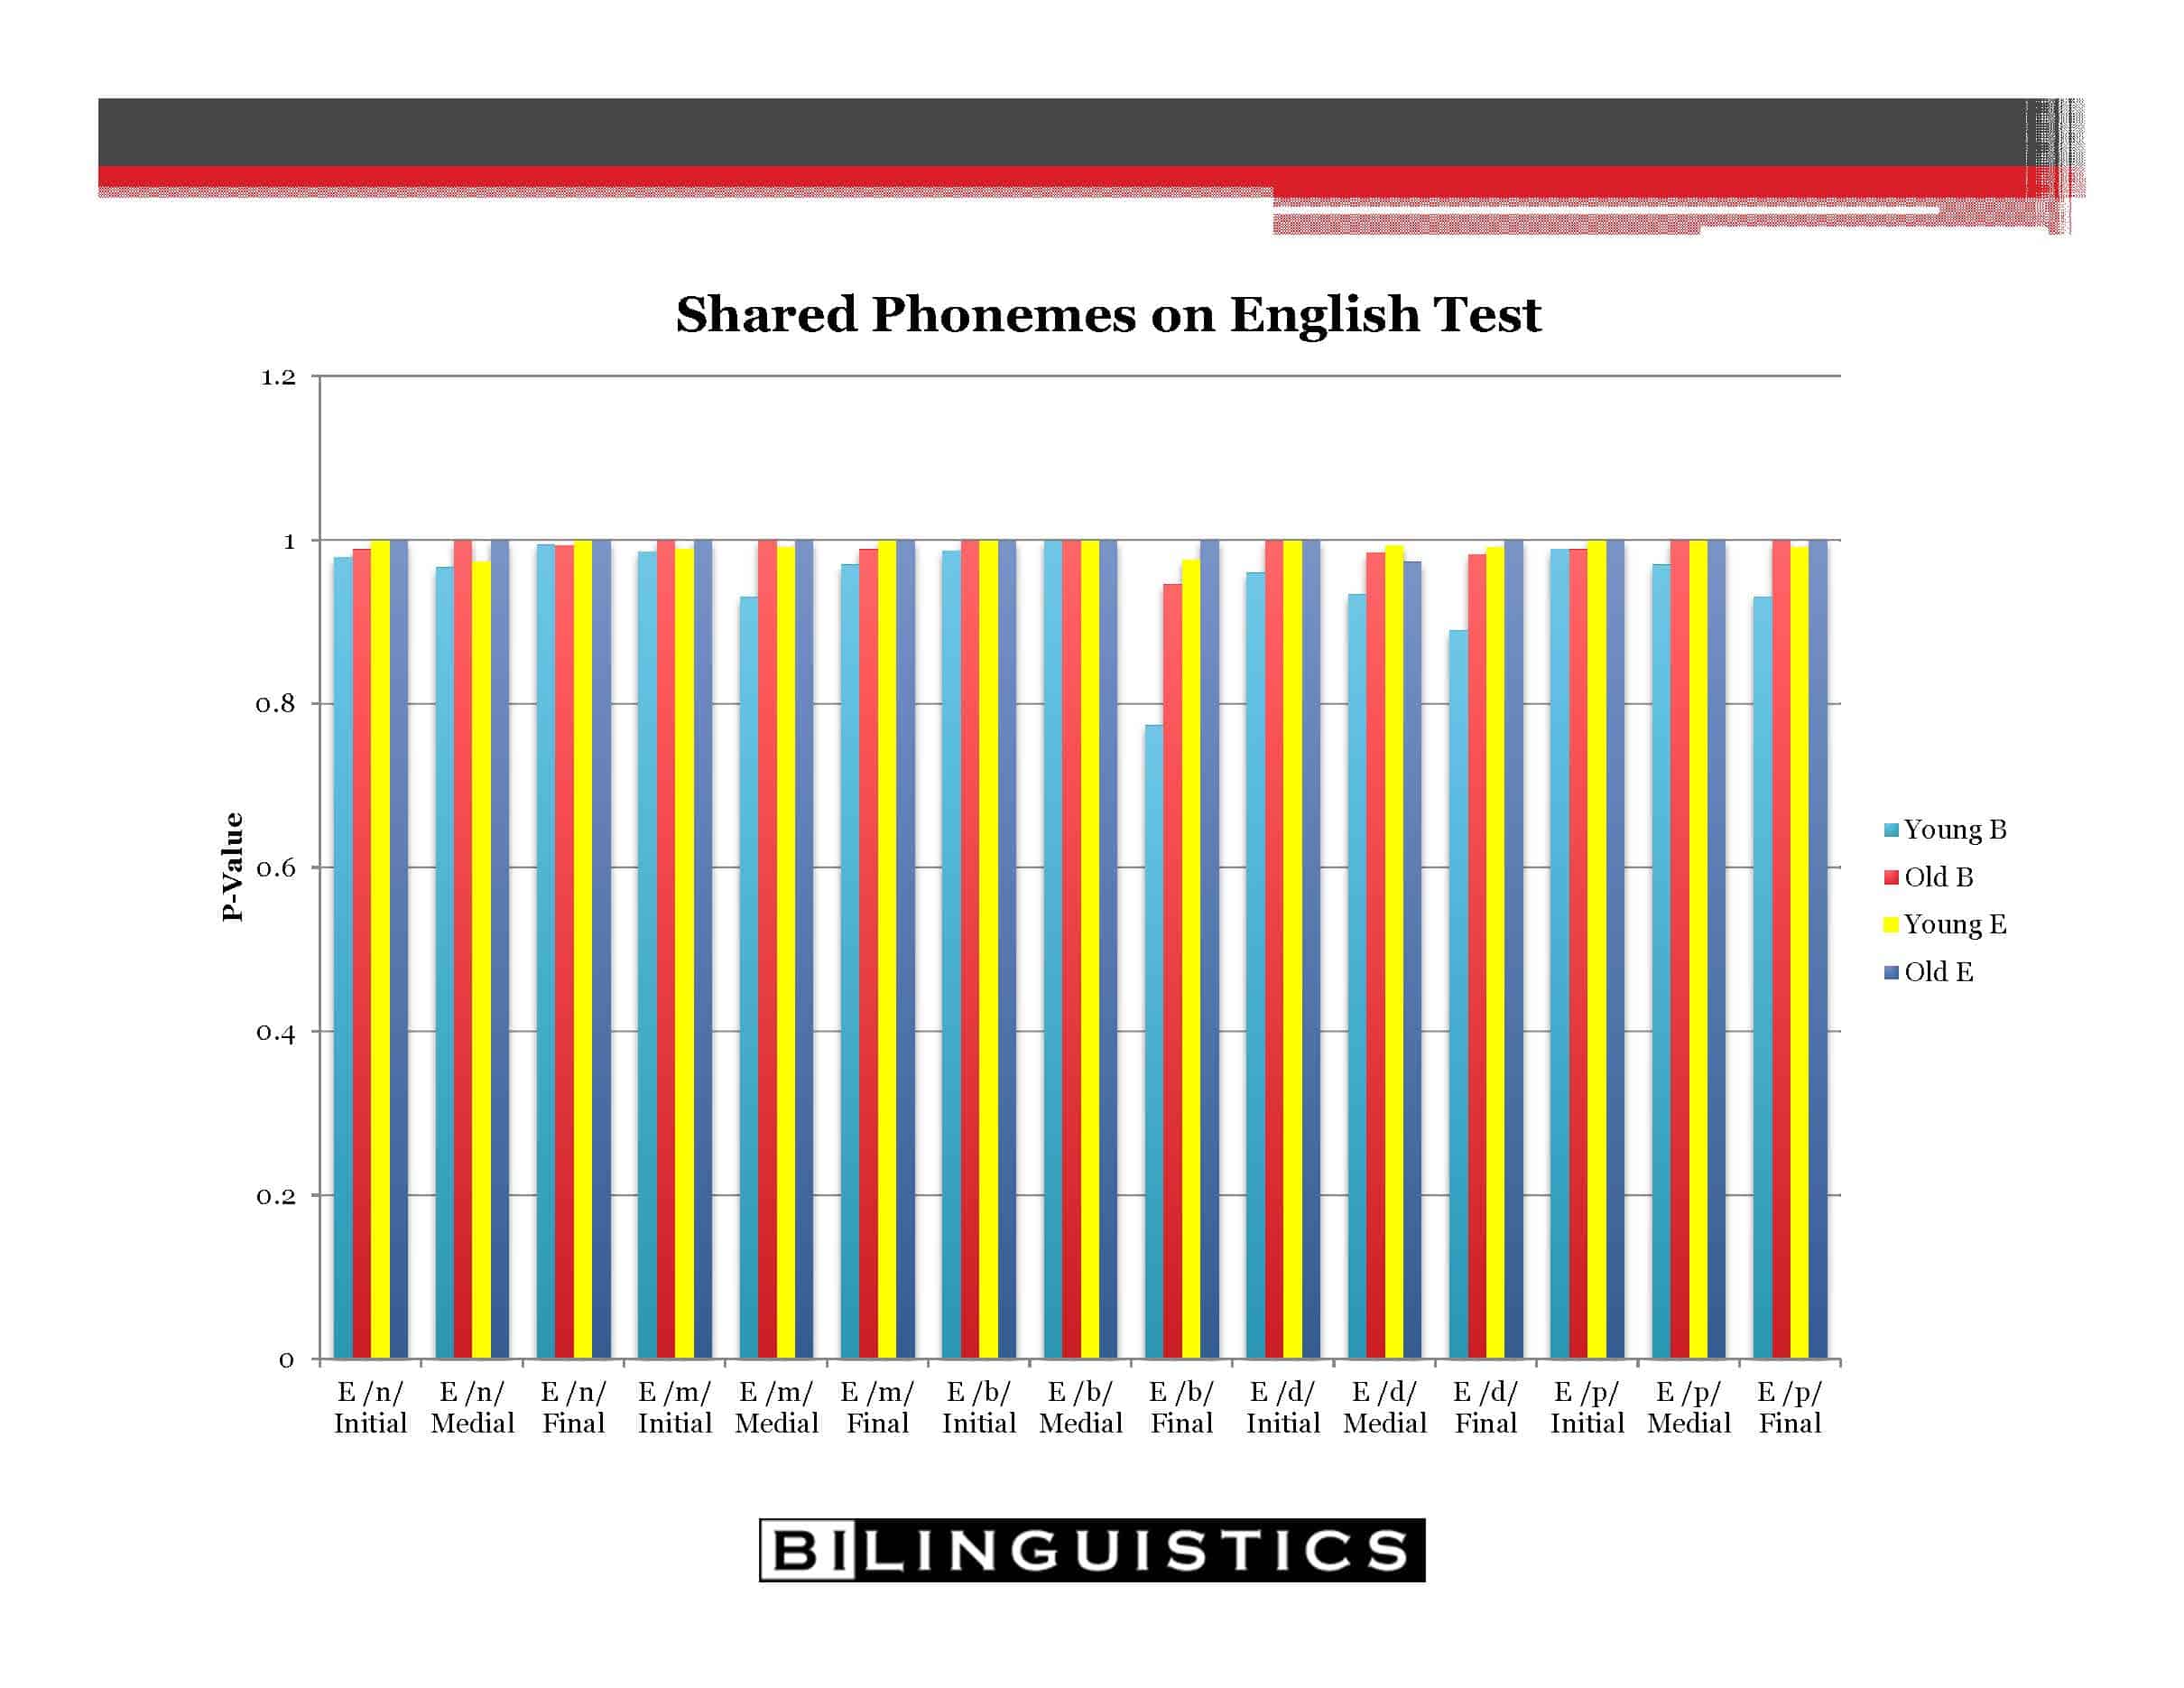
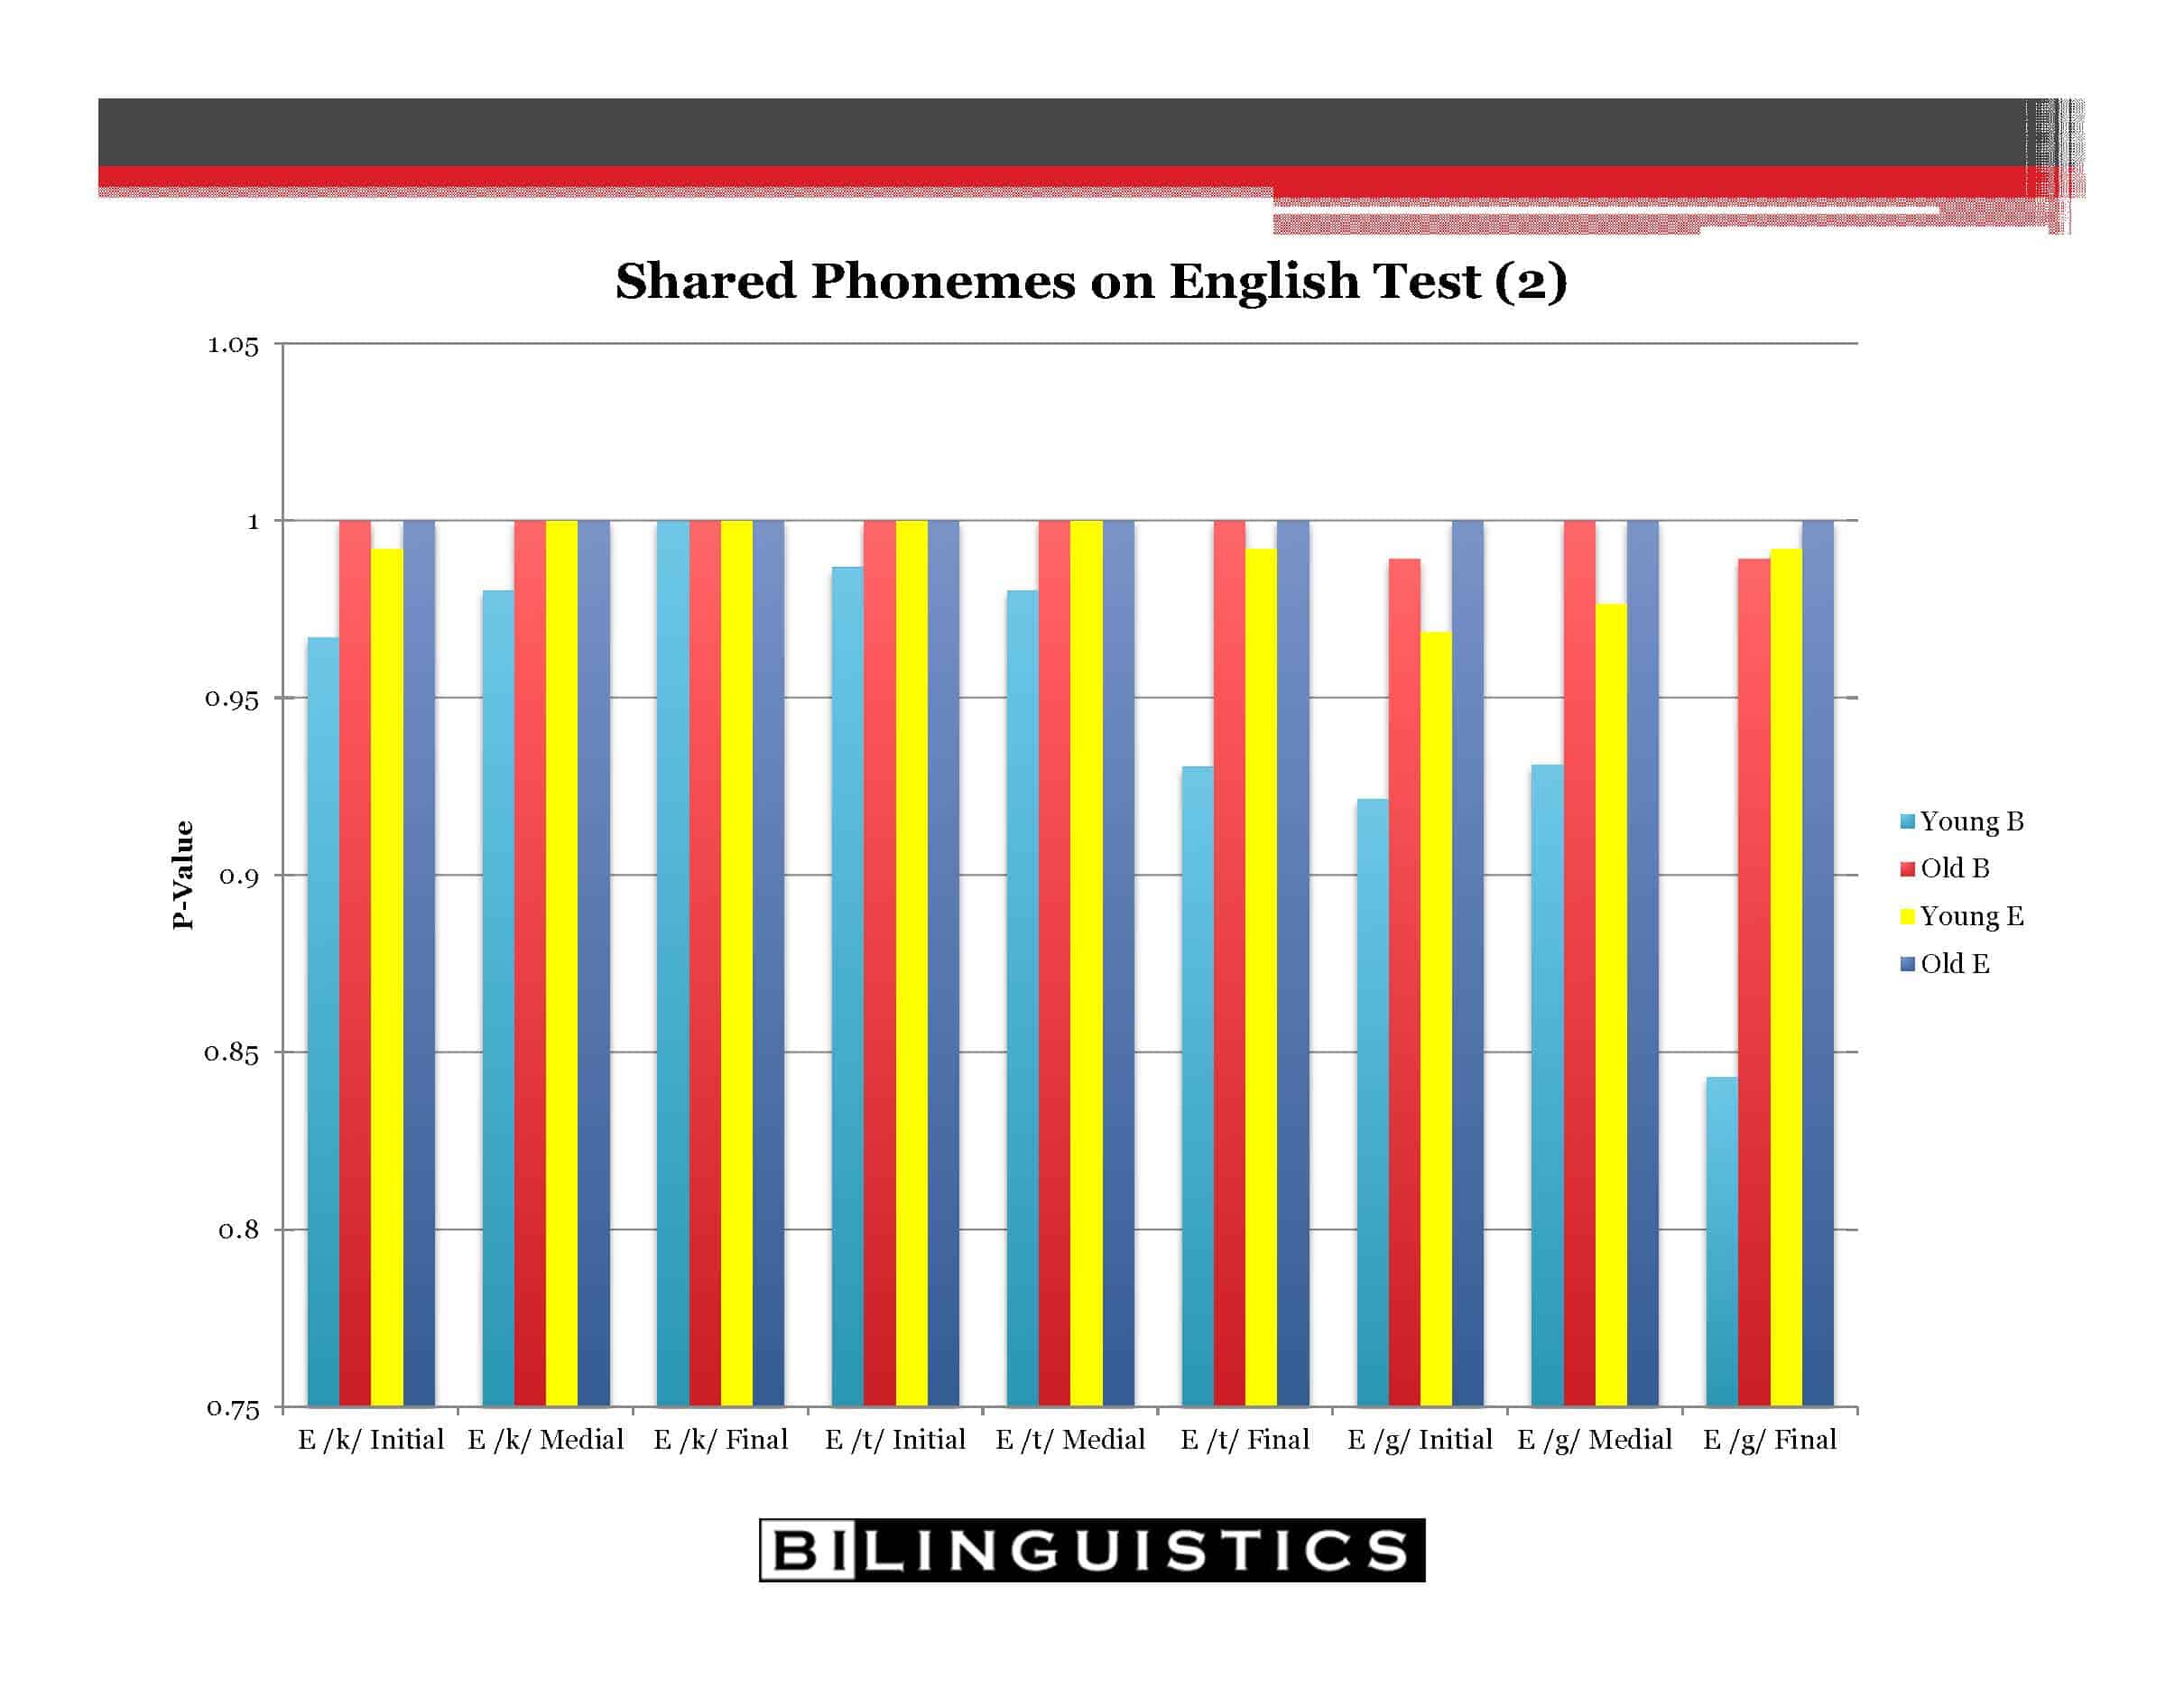
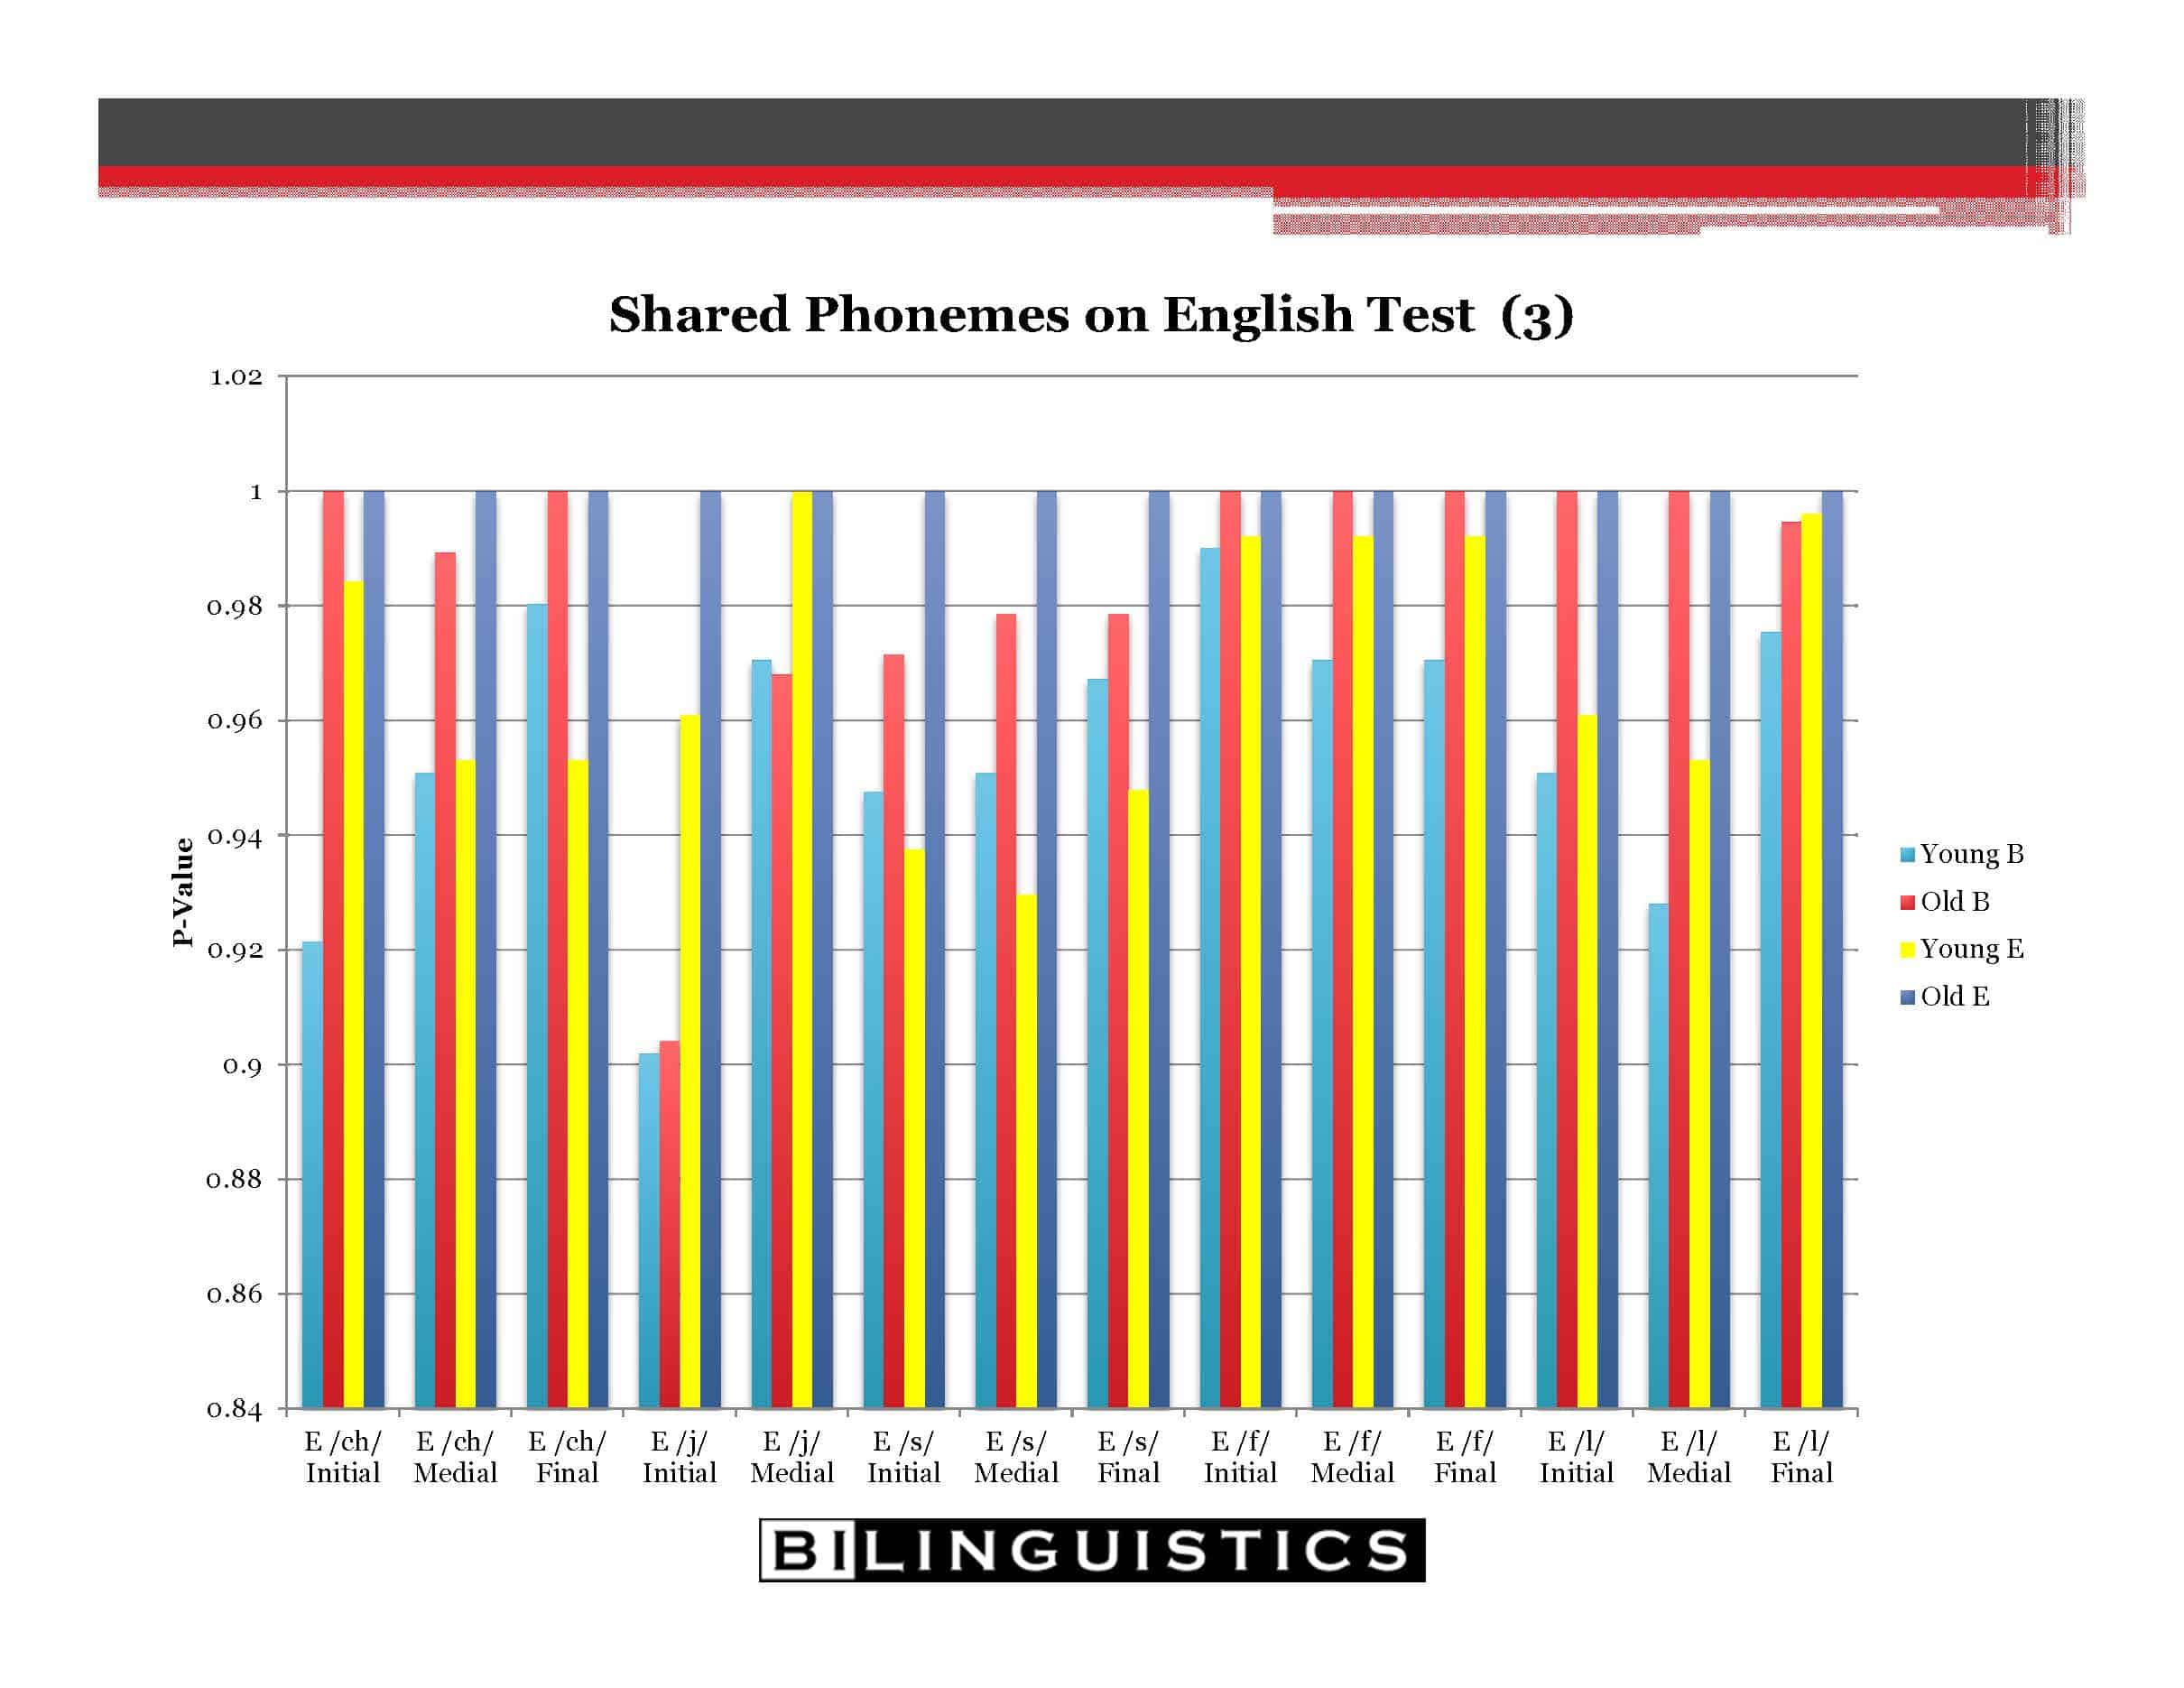
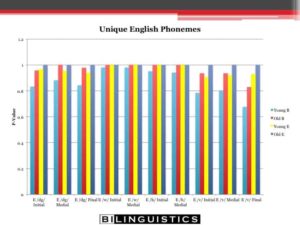
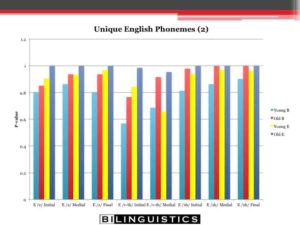
This gets a bit thick but you should get two things from the graphs below: 1) An unexpected craving for Lifesavers Candy. 2) The sounds in the center of the Venn Diagram are in graph 1 and there are very minimal differences between Primary- and Secondary Language Learners of English.
Our hypothesis:
Second-language learners should not have difficulty with the sounds that are shared in both languages.
The results:
This was true! Graph 1 shows the shared sounds between both languages and notice that there is very little error (difference in performance). Graphs 2 and 3 show the sounds that are shared sounds that are normally later developing sounds. You can see that younger bilinguals (ages 4-6 years) begin by not being able to master the sound but then catch up at a later age (7-9 years). Graphs 4 and 5 shows the sounds that are unique to English. You can see that the older bilingual group does not look as similar to their English-speaking peers as they did on the shared sounds–especially for the later developing unique sounds. We were so excited at how clearly the data show this and, for those of you who geek out on research, you’ll love these graphs too. To orient you to the graphs: Sounds are listed across the bottom X-axis and percent of correct productions (technically proportion of the sounds produced correctly) are on the Y-axis where “1” equals all correct productions.
The four stripes from left to right are:
Light blue: young bilingual
Red: old bilingual
Yellow: young English speaker
Dark Blue: old English speaker
How do we do this when working with our own caseloads?
We have a few resources in our library to aid in determining if a sound error is due to second language influence. Just click on the link below to download.
Venn Diagram for Spanish and English
Future directions
Can this work with all languages? We believe so. We have launched an effort to gather information on other languages which we will release here in the future. Here is an example of the direction we are heading. We hope to provide information on all of the most common languages that we encounter on our caseload.
Find other great materials on our Resource Library!
Resources
Difference vs. Disorder: Speech Development in Culturally and Linguistically Diverse Populations Online CEU Course
Determining Eligibility. (n.d.). Retrieved August 9, 2012 from http://www.dars.state.tx.us/ecis/eligibility.shtml#eligibility.
Ennis, S. R., Rios-Vargas, M., & Albert, N. G. (2011). 2010 Census Briefs: The Hispanic Population : 2010. Retrieved April 7, 2013 from http://www.census.gov/prod/cen2010/briefs/c2010br-04.pdf.
Figueroa, R. (1989). Psychological testing of linguistic-minority students: Knowledge gaps and regulations. Exceptional Children, 56, 145-148.
Gildersleeve-Neumann, C. E., Peña, E. D., Davis, B. L., & Kester, E. S. (2009). Effects on L1 during early acquisition of L2: Speech changes in Spanish at first English contact. Bilingualism: Language and Cognition, 12, pp 259-272.
Gildersleeve-Neumann, C. E., Kester, E. S., Davis, B. L., & Peña, E. D. (2008). English Speech Sound Development in Preschool-Aged Children From Bilingual English–Spanish Environments. Language, Speech, and Hearing Services in Schools, 39, 314-328.
Goldstein, B. (2011, ed.), Bilingual language development and disorders in Spanish-English speakers (2nd ed.). Baltimore, MD: Brookes Publishing.
Goldstein, B. & Fabiano, L. (2005). Phonological Skills in Predominantly English-Speaking, Predominantly Spanish-Speaking, and Spanish-English Bilingual Children. Language, Speech, and Hearing Services in the Schools, 36, 201-218.




This information was extremely helpful! I was unable to print the GFTA overlay or the Spanish and English Phonemes chart. Would it be possible for you to send it to me?
Thanks! Meg
I am unable to download the venn diagrams except the vowel venn diagram. Could someone email them to me?
The Venn Diagrams can be downloaded as pdfs in full size from our resource library here. I will also add a link from the blog post. Thanks!
https://bilinguistics.com/speech-therapy-materials/
So, if you are saying a bilingual child is later with acquiring sounds shared between the two languages, would it be reasonable to also expect a delay but eventual acquisition of non-shared sounds? I’m specifically thinking of a 9 year old (bilingual from birth) with difficulty with English “r” sounds (brought to my attention by a classroom teacher), but whose Spanish “r” is rolled perfectly. Would inclusion in an informal articulation group be appropriate or best to leave it alone?
Yes, it would be reasonable to address the /r/ with this student. After 9 years of exposure to the sound it would be assumed that it should have been acquired naturally. With the trilled /r/ in place, hopefully this will be a quick turnaround!
I have an second grade EL student with a L1 that has no /r/ sound but was referred to have an intervention for the /r/ sound (because of her age). She is proficient in her L1. Is that appropriate?
From your brief description, that sounds like a student with a speech difference rather than a speech disorder. Here are some questions you can ask to help decide whether the referral is appropriate: Is the English /r/ the only sound of concern? Does she substitute a sound that is produced in a similar location/fashion from her language? Are there any concerns in her native language? How long has she been exposed to English? What percentage of the time does she hear English versus her native language? Good luck! Let us know what you decide.
Thanks for this great article.
Do you have a “French and English Phonemes” Venn diagram?
As an ESL teacher it France, it would me out enormously.
HI David, we have an entire chapter on French in our Difference or Disorder book. It has the shared and unshared speech sounds as well as language differences.
Difference or Disorder?
Very interesting and helpful information. Thank you for sharing. Do you have a German and English Phonemes Venn Diagram? I am a speech therapist at a bilingual school in Atlanta. It would be very helpful.
Thank you,
Yvonne
Hi Yvonne,
Thanks for your response. Yes! We have an entire chapter on speech and language development of German in comparison to English in our Difference or Disorder book. There is also information on other languages you may encounter in Atlanta (12 languages and AAE).
Is there any information for a student who also speaks Telegu at home?
I have not yet compiled information on Telegu. When I do, we’ll do a blog post about it.
Ellen
Hi ! Would you work on /th/ if there is a Spanish influence at home ( parents, family) but student doesn’t speak much Spanish? I’m in middle school and get many of these students from elementary.
Hi Roberta, There is a bunch to consider since you are working in the schools. Yes you can focus on the /th/ if you deem it necessary but if no one in their environment is using it, they might not learn without a big dose of motivation on their part.
1. Educational need: Can they identify it in reading, do they write it without error?
2. Do their friends use the /th/?
3. Can they produce it easily? Many students can create a perfect /th/ in 2 seconds. Is it habit or truly a problem?
4. Here is food for thought: with media and shifting cultures, the /th/ is expected to be extinct for all of us in the near future.
Thank you very much for this information. Do you by any chance have Phoneme Venn Diagrams for Swahili/English or Arabic/English?
Hi Jennifer,
We do have a chapter on Arabic/English is the Difference or Disorder book. We haven’t tackled Swahili yet but it’s on our list.
Best, Ellen
Hello,
I have a rising number of 2nd grade and 3rd grade Spanish speaking students that do not have the English variations of the vocalic ‘r’ (e.g,, pour, peer, air, father), but have both the trilled ‘r’ and flap ‘r’ in Spanish. They are in bilingual classes learning both languages with no other noted concerns. Is this a difference or disorder?
Thanks!
I have had a number of students who I began with (Spanish) and I shifted over to the English-SLP around 3rd grade for the English R. Here is the thinking on it: It all depends on how long the child has been in the country and has spoken English. By 3rd grade, most are fluent and all of their friends who have the same history are producing the English R(s) without a problem. I am generalizing here but typically if a child has 5-7 years exposure to English they can produce an English /R/ with a simple model or a verbal cue. If they are struggling to do that, it would be grounds to investigate more. A side note, the Spanish /R/ comes in a bit earlier so it is not uncommon that they get their Rs in Spanish prior to English.
I have noticed several bilingual Spanish-English students who coarticulate /n/ on the end of vocalic /r/ (mostly in /or/), so “core” /kor/ becomes /korn/. I thought it was just a distortion, but I keep seeing it. Is this an atypical error or is there an issue of transfer?
Thank you!
Hi Cathy,
This certainly could be an issue of transfer or influence from the native language. Since there is no vocalic /r/ in Spanish or anything like it in word final position, it is possible that these students are going to a sound that can exists in word final position in Spanish. The flap /r/ and /n/ are both allowable sounds at the ends of words and might be the closest sounds that these students would substitute.
Thank you very much for this information. Do you by any chance have Phoneme Venn Diagrams for Bengali/English or Chinese/English?
We have the Venn Diagrams for Mandarin in our Difference or Disorder resource tool.
I don’t see the diagrams in your resource library? Have they been moved? Thanks!
These 3 images in this post you can just right-click to download. The Venn diagrams for Spanish are in the Resource Library.